Cryptocurrency investing recorded another positive week last week, with inflows reaching $3.2 billion for the month. ETFs remain the main driver of capital entering the market.
The cryptocurrency market overall has been strong this week, with a few catalysts emerging. This raises the possibility of more capital inflows this week.
Cryptocurrency investments hit $3.2 billion in three weeks
Last week, cryptocurrency investments saw a surge, with inflows reaching $1.35 billion in the third week of July. This remarkable increase brought the total cryptocurrency investments for the month to an impressive $3.2 billion. The spike was mainly attributed to a surge in Bitcoin (BTC) purchases, amounting to $1.27 billion. Conversely, short Bitcoin ETPs had outflows of up to $1.9 million, according to CoinShares data sourced from Bloomberg.
Ethereum also saw positive flows, reaching $45.3 million, surpassing Solana in the altcoin index to become the largest inflow for the year.
The interest in Ethereum is not surprising, especially with the upcoming launch of five Ethereum spot ETFs on the Chicago Board Options Exchange (Cboe) on July 23. These ETFs include the Fidelity Ethereum Fund, Franklin Ethereum ETF, Invesco Galaxy Ethereum ETF, VanEck Ethereum ETF, and 21Shares Core Ethereum ETF.
Transitioning to the next section…
Ethereum Options Open Interest Surges with Ethereum ETFs on the Horizon
Prior to the launch of the Ethereum ETF, there has been a significant surge in open interest in Ethereum options on the Deribit exchange. Data from Deribit indicates that the implied volatility of Ethereum options has increased by 26% since last week, pointing towards heightened market interest and activity that is likely to lead to increased volatility in Ethereum’s price.

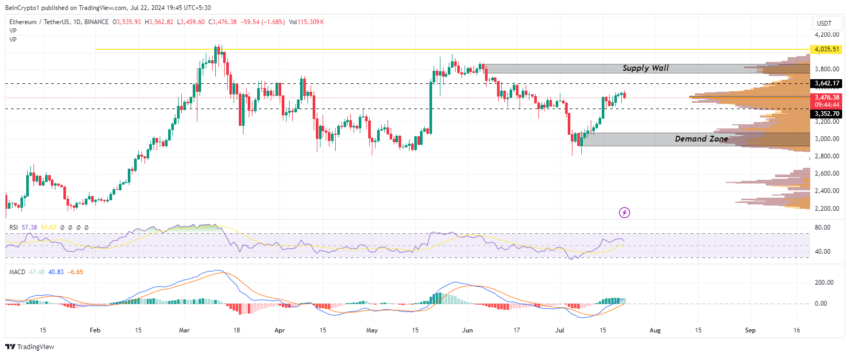
As Ethereum’s price hovers within the daily bottom range of $3,352 to $3,642, there is significant activity between the bullish and bearish ranges. The Relative Strength Index (RSI) remains above the 50 average, indicating strength in the Ethereum market. Additionally, the Moving Average Convergence Divergence (MACD) suggests that buying power currently exceeds selling power.
Transitioning to the final section…
Ethereum Price Analysis and Outlook
Although Ethereum has shown strength, with price action concentrated within a specific range, there are signs of potential decline. The RSI trending south and a decline in the MACD histogram suggest waning momentum. Ethereum must surpass the resistance levels between $3,760 and $3,866 for the upward trend to continue.

Should Ethereum breach the lower limit of the bottom range at $3,352, panic selling may be triggered. However, a more substantial decline would require Ethereum to fall below $2,924, undermining its bullish stance.
These developments indicate a critical juncture for Ethereum and its price movements in the near term, particularly with the launch of the Ethereum ETF and heightened market activity.
The information contained on the BeInCrypto website is published in good faith and for informational purposes only. Users are solely responsible for any consequences arising from the use of the information on this website. In addition, part of the content is the AI translation version of the English version of the BeInCrypto article.


